.png)
GitHub is an essential platform for managing and contributing to open-source projects. While GitHub provides an excellent UI for navigating your repositories, an insights dashboard can give you a bird' s-eye view of essential metrics like stars, forks, issues, and pull requests.

In this guide, we'll build a GitHub Insights Dashboard using the GraphQL API. We’ll fetch critical data from GitHub and visualize it using Python. By the end of this tutorial, you’ll know how to create a personalized dashboard that gives instant insights into your GitHub repositories.
Check out the whole project on GitHub to see how it all comes together!
GitHub Repository: github-insights-dashboard
What You’ll Learn
How do you connect to the GitHub GraphQL API?
Fetch repository metrics like stars, forks, issues, and pull requests.
Visualize the data using Python.
Let’s get started!
Step 1: Getting Your GitHub Personal Access Token
Before diving into the code, you must set up a GitHub Personal Access Token. This token lets you access your own GitHub data securely.
How to Generate the Token
Head to your GitHub account.
Go to Settings > Developer Settings > Personal access tokens.

Click on Generate new token.

Select permissions like repo and read user.
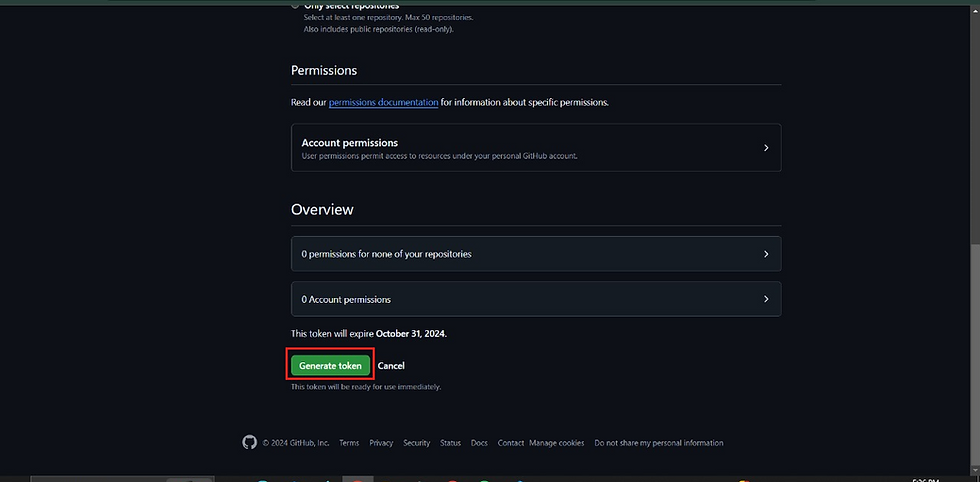
Copy the token once it’s generated—you won’t be able to see it again!
Once you’ve got your token, keep it handy because you’ll need it for the next steps.
Step 2: Fetching Data with GraphQL
Now that we’re authenticated let’s dive into the fun part: using GraphQL to pull your repository metrics. GraphQL is much more flexible than REST APIs because it lets you grab exactly what you need with a single query.
Here’s a Python script that pulls some key metrics (stars, forks, pull requests, issues) for your repositories:
Python:
import requests
import pandas as pd
import matplotlib.pyplot as plt
# Replace with your actual GitHub Personal Access Token
GITHUB_TOKEN = 'YOUR_GITHUB_TOKEN'
headers = {"Authorization": f"Bearer {GITHUB_TOKEN}"}

# GraphQL query for repository metrics
def run_query(query):
    response = requests.post('https://api.github.com/graphql', json={'query': query}, headers=headers)
    if response.status_code == 200:
        return response.json()
    else:
        raise Exception(f"Query failed with status code {response.status_code}. {response.text}")

# Query to fetch repository data
query = """
{
  viewer {
    repositories(first: 10) {
      nodes {
        name
        stargazerCount
        forkCount
        pullRequests {
          totalCount
        }
        issues {
      totalCount
        }
      }
    }
  }
}
"""
# Running the query
result = run_query(query)
# Process data into a structured format
repos_data = []
for repo in result['data']['viewer']['repositories']['nodes']:
    repos_data.append({
        'Repository': repo['name'],
        'Stars': repo['stargazerCount'],
        'Forks': repo['forkCount'],
        'Pull Requests': repo['pullRequests']['totalCount'],
        'Issues': repo['issues']['totalCount']    })
# Convert to a DataFrame
df = pd.DataFrame(repos_data)
print(df)
# Visualizing the data using matplotlib
df.set_index('Repository', inplace=True)
df.plot(kind='bar', figsize=(10, 6), title="GitHub Repository Metrics")
plt.ylabel('Count')
plt.tight_layout()
plt.show()
What This Code Does
Authentication: The personal access token is sent in the request headers to authenticate you with GitHub.
GraphQL Query: This query fetches the first ten repositories, along with stars, forks, pull requests, and issues.
Data Processing: We loop through the fetched data and store it in a pandas frame for easy analysis.
Visualization: We use Matplotlib to visualize the fetched data as a bar chart.
Output:
Step 3: Visualizing Your GitHub Metrics
Once the Python script runs, you’ll see a nice bar chart showing the stars, forks, pull requests, and issues for each of your top 10 repositories.
You can tweak the GraphQL query to fetch more information, like commit history, contributor stats, or even the languages used. This flexibility is one of the key reasons for using the GitHub GraphQL API.
Why Use GitHub's GraphQL API Instead of REST?
If you’ve worked with REST APIs before, you know the drill—multiple API requests to fetch data from different endpoints. GraphQL simplifies this by letting you send a single request that pulls all the data you need. Plus, it’s more efficient since you can customize your queries and avoid over-fetching.
Conclusion
And that’s it! You’ve successfully built a GitHub Insights Dashboard that pulls critical metrics from your repositories using the GraphQL API. You can expand the dashboard by adding more queries or exploring other visualization options.
Keep playing with the GraphQL API to get more insights into your repositories. It’s a super powerful tool, especially when you want to avoid the limitations of traditional REST APIs.
References
GitHub GraphQL API Documentation - Official resource for structuring GraphQL queries and exploring GitHub data.
Python Requests Library - Documentation for the requests library, used for making HTTP requests to the GitHub API.
Pandas Documentation - Helpful for manipulating data in tabular form.
How to Generate a GitHub Personal Access Token - Step-by-step guide to generating your access token.
FAQs
1. Why use GraphQL over REST for GitHub data?
GraphQL lets you fetch multiple data types in a single request, making it more efficient and flexible than REST.
2. Can I fetch data for more than 10 repositories?
Absolutely! Just modify the first 10 parts of the GraphQL query to a higher number or paginate the results.
3. Is it possible to make the dashboard auto-update?
Yes! You can schedule the script to run at regular intervals using cron jobs (Linux/macOS) or Task Scheduler (Windows).
4. Can this dashboard display data for private repositories?
Yes, ensure your GitHub token has permission to access private repositories.
Following this guide, you can gain insights into your GitHub repositories and visualize your metrics using Python. If you want to explore more, modify the code or check out the GitHub repository where the project is hosted.
Happy coding! 🚀
Thanks for the helpful guide, Anjali! Loved how easy it was to fetch GitHub data with GraphQL. Awesome work! ✨
Keep up the great work, and looking forward to more posts like this!
Thank you for sharing this valuable and informative article about the GitHub API.
Informative post on leveraging GraphQL for GitHub Insights. The code examples are clear and concise.